AAPL:NASDAQ
Apple Inc. · Technology
- P/E (TTM)
- 38.8
- Own median since FY2020: 31.0
- REVENUE YOY · QUARTER
- +11.7%
- Net margin (TTM) 27.6%
- LAST REPORT · EPS
- 2.10
- Estimate 1.99 · beat by 5.5%
- DIVIDEND YIELDDIV. YIELD
- 0.31%
- Payout ratio 11.8%
STOCK RESEARCH & PORTFOLIO TRACKING FOR LONG-TERM INVESTORSSTOCK RESEARCH & PORTFOLIO TRACKING FOR LONG-TERM INVESTORS
Research companies before you invest. See your portfolios in one place.
Keep track of earnings and dividend dates along the way.Research companies before you invest. Track your portfolios and upcoming earnings and dividend dates.
Free plan with no time limit · No card required
Apple Inc. · Technology
3 portfolios · in USD
US$48,270.15
+8.82%YTD
 Technology 41.2%
 Healthcare 17.9%
 Consumer Defensive 14.3%
Price, ratios, statements, dividends and news live on different sites.
Positions sit with different brokers, and the total is always a guess.
An earnings report or an ex‑dividend date passes before you notice it.
BEFORE YOU BUY
Revenue and profit, earnings against estimates, dividends and valuation, laid out the same way for every stock. The price chart is there too, with reports and payouts marked on it.
Apple Inc.
US$348.51
−0.62%1D−US$2.18
At close · Nov 10, 2026
Low US$243.42High US$355.38
Fiscal year ends in September · USD
| USD bn | FY2020 | FY2021 | FY2022 | FY2023 | FY2024 | FY2025 |
|---|---|---|---|---|---|---|
| Revenue | 274.5 | 365.8 | 394.3 | 383.3 | 391.0 | 416.2 |
| Gross profit | 105.0 | 152.8 | 170.8 | 169.1 | 180.7 | 195.2 |
| Operating income | 66.3 | 108.9 | 119.4 | 114.3 | 123.2 | 133.1 |
| Net income | 57.4 | 94.7 | 99.8 | 97.0 | 93.7 | 112.0 |
| EPS diluted, USD | 3.28 | 5.61 | 6.11 | 6.13 | 6.08 | 7.46 |
EPS, USD · estimate vs reported
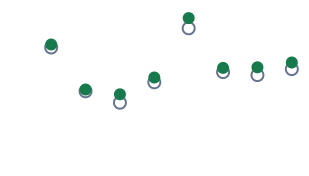
 Estimate
 Beat
 Miss
Last report Nov 2, 2026
EPS 2.10 vs estimate 1.99 (+5.5%)
Last 8 payments · per share
AFTER YOU BUY
Add your trades to track portfolio value, individual holdings and where your money is invested.
Jan 1 – Nov 10, 2026 · daily close prices
US$48,270.15
+8.82%YTD+US$3,912.40
+8.82% · YTD
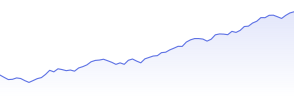
Jan – Nov 2026 · close prices
See sector and industry allocation, your largest holdings and the stocks driving portfolio changes. Each portfolio can use its own currency.
November 2026 · all portfolios
| SUN | MON | TUE | WED | THU | FRI | SAT |
|---|---|---|---|---|---|---|
| D · AAPL | ||||||
| E · HDE · NVDA | D · MSFT | |||||
| D · JNJ | ||||||
| D · KO |
BETWEEN DECISIONS
When is the next earnings report? When is the ex-dividend date? See events for your holdings in one calendar.
When is the next earnings report? When is the ex-dividend date? Keep events for your holdings in view.
Next 90 days
Apple Inc. · Ex‑dividend date · US$0.27
DividendNVIDIA Corp. · After market close
EarningsA calendar for each portfolio and all of them together. See upcoming events for the next 90 days.
FIND YOUR NEXT RESEARCH IDEA
Filter by country, sector, industry, exchange and currency. Find a company in the screener, then open its stock page to research it.
Filter by country, sector, industry, exchange and currency, then open a company to research it.
START WITH YOUR FIRST PORTFOLIO
Use the Free plan for as long as you like. Choose Pro or Premium when you need more portfolios and holdings.
Create an account, set up a portfolio and enter your trades. Then follow its value and upcoming events.
Sign up with email or Google.
Add a portfolio, then enter each trade's date and price.
Follow value, allocation and upcoming events.
Need more portfolios?Pro US$9.95 / month · Premium US$19.95 / monthCompare plans
US$0forever
No card required
The Free plan has no time limit. Need more portfolios? Pro is US$9.95 / month, Premium US$19.95 / month.
Compare plansEnter your trades by hand: the date, price and quantity of each buy and sell.
Prices, financials, events and news come from Twelve Data. Portfolio values use daily closing prices.
Export a portfolio to CSV or JSON. You can import a Stockwayup JSON export back into the service.
Yes. Pick a currency for each portfolio and a reporting currency for your totals, for example euros. Amounts in other currencies are converted automatically.
Create a free account to research companies, track your portfolios
and follow reports and dividends in one place.
